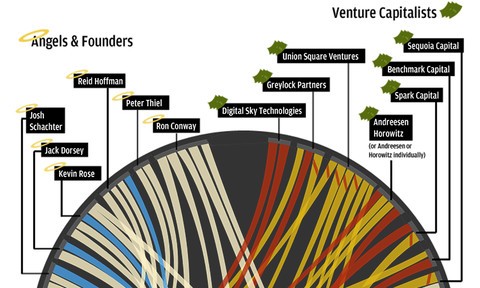
In this course, author Shane Snow shows how to depict complex relationships in an easy-to-understand infographic, or graphic representation of data. The course covers building a multi-relationship radial diagram, illustrating connections between relationships, and creating legends, as well as designing title and source credits and adjusting the placement of design elements post-illustration.
Learn More